Demo: Executive Function OS
Cognitive Flight Recorder / Translation Manual
Observer Layer: Raw Trace
The raw, unfiltered digital footprint of activity before interpretation.
- Density:
Variable - Status:
Monitoring - Timestamp:
23:04:04 GMT
System Typologies
Type 1 — Solvable
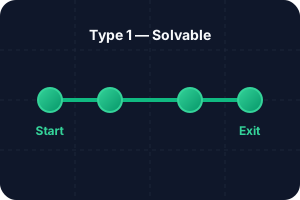
A healthy system with clear goals.
- Observer: Predictable outcome loops
- Operator: Belief aligns with reality
Type 2 — Complex Navigable
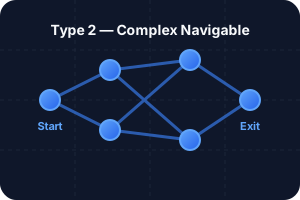
Intricate system requiring navigation.
- Observer: Branching clusters
- Operator: Probabilistic heuristics
Type 3 — Corrupted
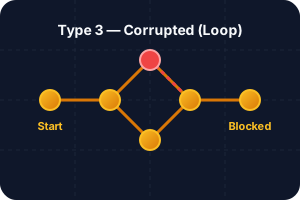
Repetitive, unproductive cycling.
- Observer: Inverse outcomes
- Operator: Dominated by corrupted installations
Type 4 — Paradox System
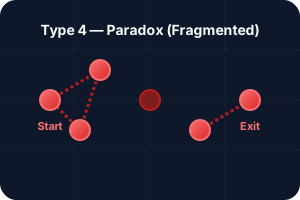
Extreme fragmentation or lock-in — both pathological extremes in this model.
Intervention Threshold
Alert
Critical point prior to collapse. Trigger BMS 4.0 Protocols
Operator Output Layer
Resolved — Post-intervention state. The clean, optimized action layer.
- Fragmentation:
0.42% (Stabilized) - Operator Inference:
Successfully Exited
Methods & Assumptions
This platform uses a percolation-theoretic framing to model cognitive network fragmentation.
- Data flow: Behavioral digital trace data are projected into a multidimensional state space.
- Transformations: DBSCAN identifies irregular behavioral clusters. Network edges are then constructed from temporal adjacency, cluster similarity, and file co-occurrence.
- Assumptions: The model treats "Observer" and "Operator" states as networked processes bridged by executive-function nodes. Stress preferentially degrades those bridges.
Planned HybridRAG Expansion
| Output | Data Source | Purpose |
|---|---|---|
| Conversation State | Knowledge Graph + Timeline | Near real-time after initial indexing; dynamic filters query cached graph. |
| Executive Function Gaps | LLM Pattern Detection | Identify decision friction, deferral patterns |
| Procedural Bottlenecks | Graph Analysis | Circular dependencies, unresolved paths |
| Observer vs Operator | Text Classification | Ground truth vs belief divergence (e.g., inferred vs recorded paths) |
Interpretation & Limitations
The percolation simulation shows how network connectivity changes under stress. A connected state indicates pathways for execution. A broken state indicates reduced coordination, localized fixation, or task paralysis.
Limitations: This is a theoretical model. It does not represent a clinical diagnosis or a direct map of neural pathways. It should not be used to infer treatment efficacy or broad cognitive capacity.
Validation & Next Steps
Current checks are internal: face validity, logical consistency, and verification under assumed parameters. External validation against N=1 or larger cohort data is ongoing. The goal is a transparent, reproducible tool for computational psychiatry.
Learn about the Planned Case-File Pipeline
Interactive Simulator (Placeholder)
Interactive widget will be embedded here.
Stress Percolation Slider | Graph Visualization | Real-time Fragmentation Score